Creating a concept map as a teaching/learning tool is all about what Chris Orwig refers to when he describes the poetics of pictures: it is not only about reducing and simplifying, but also (especially) about deepening (or synthesis in teaching terms). It is this last part that makes it very difficult, and rewarding. And to make this deepening work, it is all about dialogue and collaboration, which is why I believe that class room interactions are crucial in this day and age of moving more and more to digital interactions.
As an illustration, below are some pictures of the students in my class working on a problem (“Why did the development of late summer anoxic conditions in the hypolimnion of the central basin of Lake Erie frustrate attempts to reduce nutrient loading to the lake?”).
This is the stage: Thursday class 8:30 am, during midterms. Only 1⁄3 of the students show up, which I anticipated by discussing that question since it is not a crucial part of the course. I have a starting concept map for the students, that has already taken care of the reduction and simplification part of a concept map (all the basic concepts are identified and extracted from the text book), the exercise for this class is to deepen the concept map by identifying and synthesizing the information to provide a complete answer to the question. I subdivide the class in 4 groups, and the students start by reading the question, initial concept map, text book. Of course half of the students are going over the notes for their various midterms they have that day, but there is some initial discussion going on. After 15 minutes, I ask the students to start writing their solution concept maps on whiteboards scattered throughout the class. Each group singles one person for this task, and they start the concept map.
And then the magic happens: They start disagreeing, the second person comes up, erases part of the concept map, and starts her version, a third person does the same, the students start to look up from their midterm textbooks and pay attention, provide suggestions, more discussions, and before you know it…
… every single student is looking at the whiteboard, discussing, and thinking.
My defining moment as a teacher (too bad I had to wait 5 years for this moment), and here are the pictures as proof. Afterwards, we used the different versions to explain the relative merits of the different solutions, and how these concept maps now can be used to identify fundamental solutions (or the lack thereof) for this eutrophication problem. I tried a similar approach later with the full class, and low and behold, worked again.
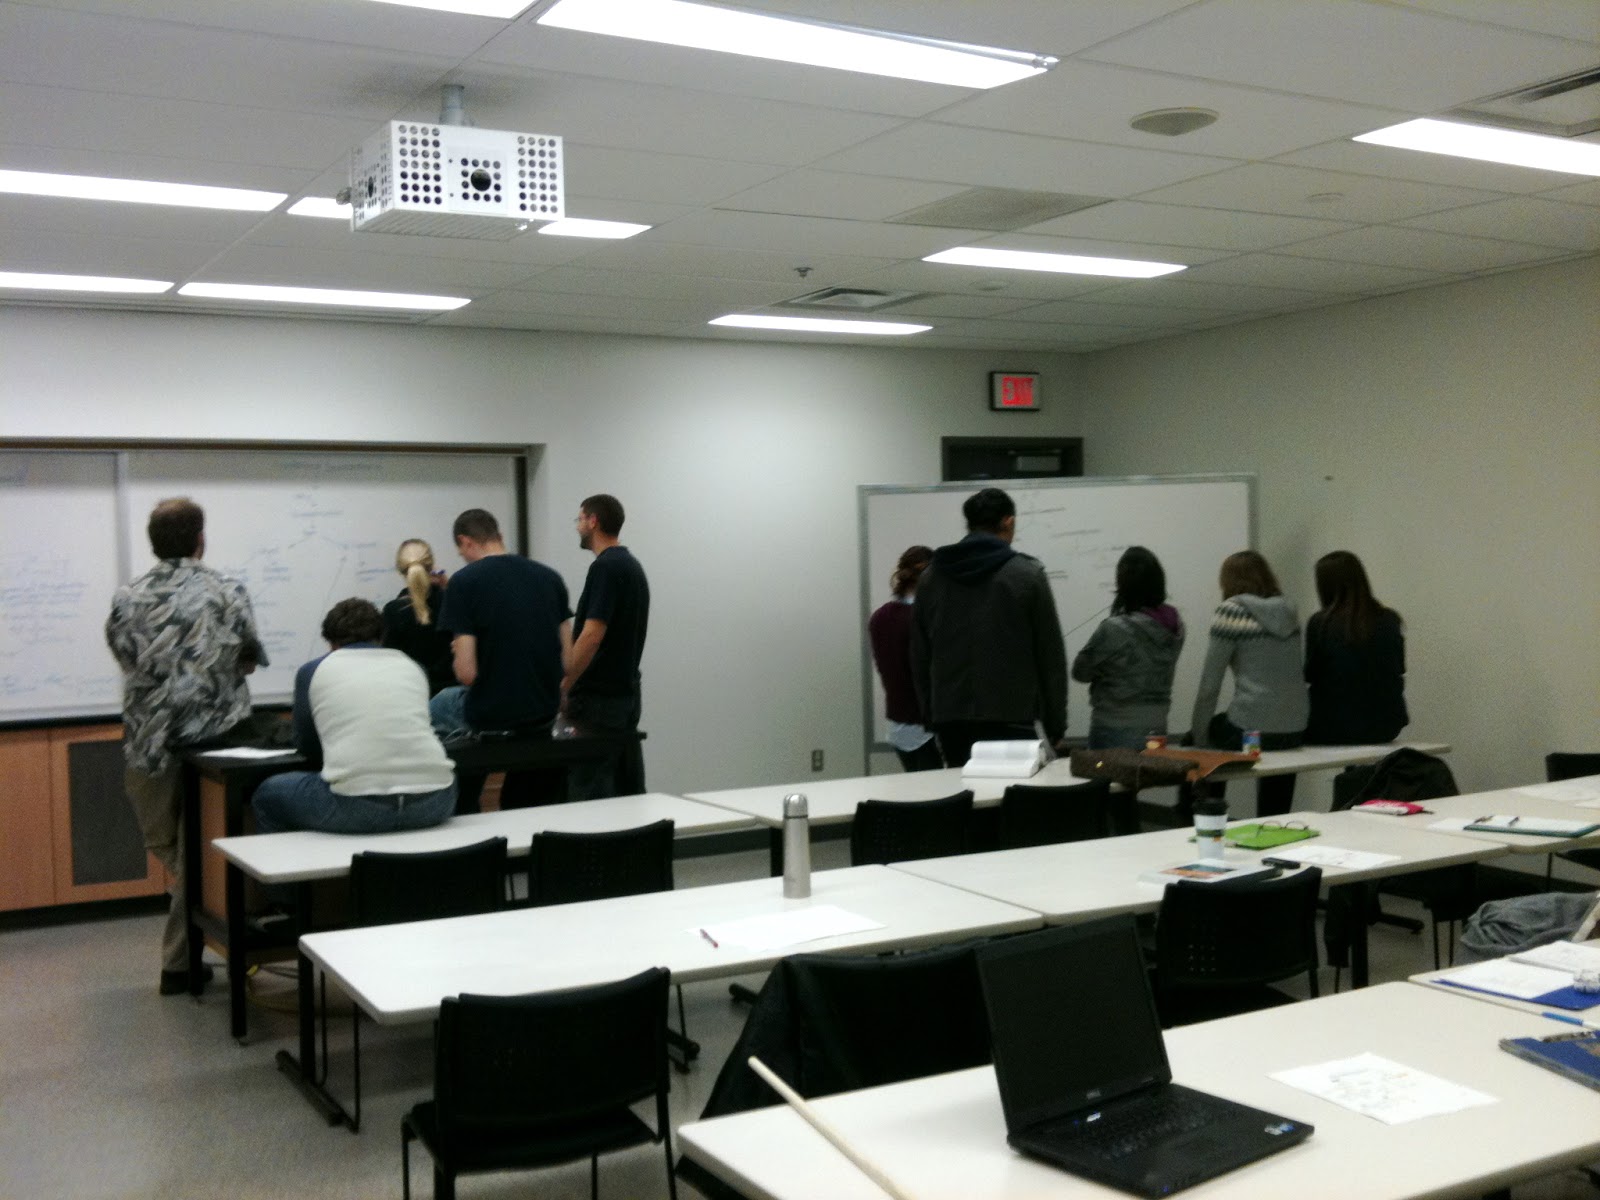


As a side note, you can see from the pictures that the concept map itself is deceptively simple: maybe 27 concepts in total, all fairly basic ones. It is the arrangement of them that showed a deeper and complete understanding of the problem, and as a class they needed 80 minutes to get to that point. The two main difficulties for this problem were 1) identifying the major hierarchy, and 2) 2 cross links between the two branches of the hierarchy. I could have just shown them the final concept map, and they would have learned nothing.